


Measuring Hip Joint Laxity
Measuring Hip Joint Laxity
PennHIP uses a unique method, an index, to measure hip joint laxity.
The method is quantitative (i.e., it assigns a number to joint laxity) as opposed to being qualitative or subjective (e.g. excellent, good, fair, etc.). The index is not as vulnerable to inter- and intra-observer errors commonly associated with subjective measurement systems.
 The index method is calculated by digitally superimposing precision circle gauges on the cortical margins (rims) of the acetabulum and femoral heads (example at left) to identify the respective geometric centers. On the compression view, if the joint is free of osteoarthritis, the centers of the acetabulum and femoral head should coincide indicating that the joint is indeed concentric. On the distraction view, the distractive force causes separation between the centers. The distance, d, between the centers is a measure of hip joint laxity. However, dalso varies with dog size (larger dogs would likely have larger d‘s than smaller dogs), with growth of the dog from puppy to adult, and with magnification due to variation in hip-to-film distance. To circumvent these potential sources of variation, d is normalized with respect to the size of femoral head and acetabulum by dividing it by the radius of the femoral head, r. The resulting index, Distraction Index = d/r, is a unitless number ranging from 0 to 1 (or more). The laxity index computed for the compression view is called a compression index (CI), likewise, the laxity index for the distraction view is called the distraction index (DI).
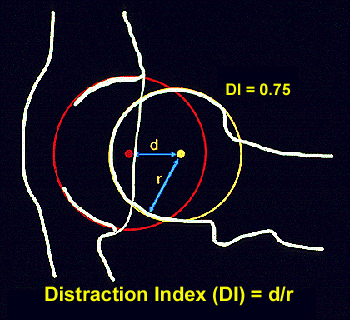 The distraction index is a measurement of hip joint laxity. It does not allude to a passing or failing score. Hips with DIs on the distraction view that are less than 0.3 are considered to be tight, while DIs close to 1 are considered to be extremely loose. The DI is an indication of the “percent out of joint” that the femoral head is displaced from the acetabulum. For example, DI=0.58 means the femoral head comes out of the joint by 58%, DI=0.75, 75% out of joint (see figure), and so on. This also makes interpretation of the DI more intuitive: a hip with a DI=0.50 is twice as lax as a hip with a DI=0.25.
To obtain proper diagnostic radiographs, the musculature around the hip must be completely relaxed and so the dog must be under deep sedation or general anesthesia. Therefore, the laxity as determined by the DI is called passive hip laxity, as opposed to functional hip laxity which is the pathological form of hip laxity that occurs in dysplastic hips during weight bearing. (Clearly, functional hip laxity is of greater diagnostic interest, but there are presently no methods to measure it.)
Laxity and Osteoarthritis
For over 60 years, it has been empirically accepted that hip joint laxity is related to the development of osteoarthritis (OA) or degenerative joint disease (DJD).
The Risk of Developing Osteoarthritis
However, prior to the research conducted at the University of Pennsylvania, there existed little or no scientific evidence to support this view. The problem was approached in two ways: First, the relationship of hip joint laxity with the coexistence of OA in a cross-section of adult dogs was examined (a cross-sectional study). Next, the relationship of laxity at an early age with the appearance of OA at a later time was investigated (a longitudinal study). The results are summarized below.
Cross-sectional Study
An analysis of 142 dogs (mean age of 20 months) showed a direct relationship of hip laxity (as determined by the DI) to the radiographic existence of OA. Hips with low DI’s, i.e. “tight hips”, were very unlikely to exhibit OA. In this study only one hip with a DI less than 0.30 exhibited any evidence of OA (DI = 0.29). The converse was not true; that is, not all hips with a DI greater than 0.30 necessarily showed radiographic evidence of OA at the time of evaluation. However, as the DI increased, so did the frequency of OA. (see the graph below).
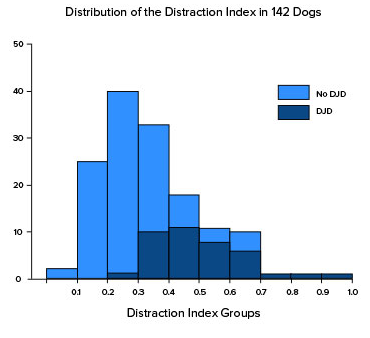
It is interesting to note that more than 50% of the hips in this study had distraction indices below 0.30, yet only one hip in this group < 0.30 showed any radiographic evidence of OA. There appears to be a cut-off point – DI approximately 0.30 – below which canine hips have very low susceptibility to getting OA.
Longitudinal Study
In this study, dogs were radiographed at 4 months, 12 months, 24 months of age. A logistic regression model was invoked to determine the contribution of factors such as DI, Norberg Angle (NA), subjective score (OFA), weight and gender at 4, 12 or 24 months to the risk of developing OA at or before 3 years. The analysis indicated that the DI at all age groups was the most significant prognostic factor for OA and that the strength of the predictive power improved with age. The sex, weight, NA and subjective (OFA) score were not found to be significant factors in this study.
Since this early study we have analyzed the PennHIP database for the relationship of hip OA to the PennHIP DI in 8 breeds of dogs (See following Figure).
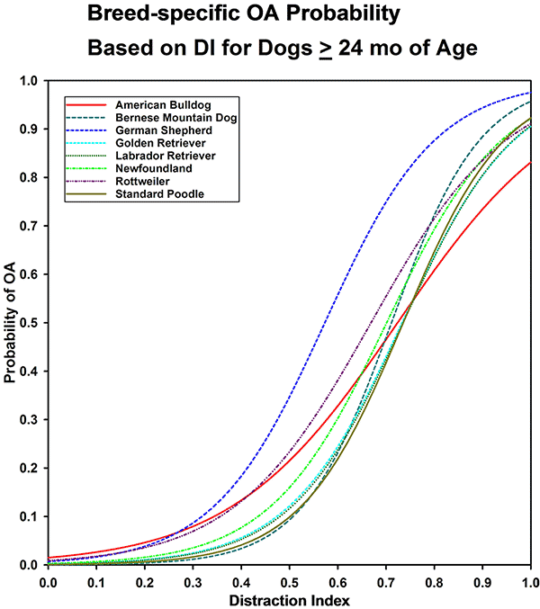
(Similar curves, based on data in the PennHIP database at the time of each publication. Published in Smith GK, Mayhew PD, Kapatkin AS, et al: Evaluation of risk factors for degenerative joint disease associated with hip dysplasia in German Shepherd Dogs, Golden Retrievers, Labrador Retrievers, and Rottweilers. J Am Vet Med Assoc 219:1719, 2001; and Runge JJ, Kelly SP, Gregor TP, et al: Distraction index as a risk factor for osteoarthritis associated with hip dysplasia in four large dog breeds. J Small Anim Pract 51:264, 2010.)
Note: The DI as a risk factor for the development of OA is analogous to the association of serum cholesterol for the risk of developing heart disease. The higher a person’s cholesterol level, the greater is the risk that the person will develop heart disease. Not all individuals, however, with high cholesterol level will necessarily develop heart disease in their lifetime. Yet to be on the safe side most people would choose to have low rather than high serum cholesterol levels because the odds are in their favor that low cholesterol means better cardiovascular health. Similarly tighter hips equate to greater OA resistance.
What is Cavitation?
If you’ve ever cracked your knuckles, you’ve created cavitation.
This phenomenon can occur, though rarely, during the distraction procedure. As the distractor device imposes a lateral distractive force on the hips, the creation of negative pressure can cause a void to form in the synovial fluid in the joint. This void appears as an air bubble on the radiograph. Cavitation is not painful and does not cause short or long-term damage to the joint. It is akin to cracking your knuckles, which is also harmless. Cavitation occurs infrequently as shown in the following published table and resolves within 24 hours.
Cavitation is problematic only because it causes the DI measurement to be unreliable. A cavitated joint can have a false increase in the DI…
Frequency of Cavitation
| Hip | N | % | 95% CI |
| Either | 279 | 4.2 | 3.7 – 4.7 |
| Right | 145 | 2.2 | 1.8 – 2.6 |
| Left | 156 | 2.3 | 2.0 – 2.7 |
| Both | 18 | 0.27 | 0.17 – 0.44 |
| LaFond E, Smith GK, Gregor TP, JAVMA,1997;210:1294-1297 | |||
Cavitation occurs unilaterally 4.2% of the time and bilaterally 0.27% of the time. The frequency of occurrence is about the same for either hip; occurring 2.2% of the time in the right hip and 2.3% of the time in the left hip.
Cavitation on the Radiograph
The appearance of cavitation on a radiograph may be unilateral (one hip), or bilateral (both hips). The cavitation void appears as a dark bubble on the radiograph (see arrow).
If cavitation is unilateral
- PennHIP will not assign a DI for the cavitated hip.
- An interpretation will be derived from the non-cavitated hip.
If cavitation is bilateral
- No DI will be generated for either hip.
- It is recommended that the evaluation be repeated in 24 hours or anytime thereafter.